
Title: Understanding Quartiles in Excel: A Geek’s Guide
Introduction: Welcome, fellow geeks! In this article, we’ll delve into the world of quartiles in Excel, exploring their significance in data analysis and visualization. Join us as we unlock the power of this statistical concept and learn how to calculate, interpret, and utilize quartiles effectively in your Excel spreadsheets. Let’s get started on our geeky journey!
Understanding Quartiles in Excel: A Technological Perspective
Understanding Quartiles in Excel: A Technological Perspective
In the fast-paced world of technology, data analysis plays a crucial role. One statistical measure that is widely used in data analysis is quartiles. Quartiles help us understand the distribution of data and identify outliers.
What are quartiles?
Quartiles divide a dataset into four equal parts. These parts are known as the first quartile (Q1), the second quartile (Q2), and the third quartile (Q3). The second quartile corresponds to the median.
Calculating quartiles in Excel
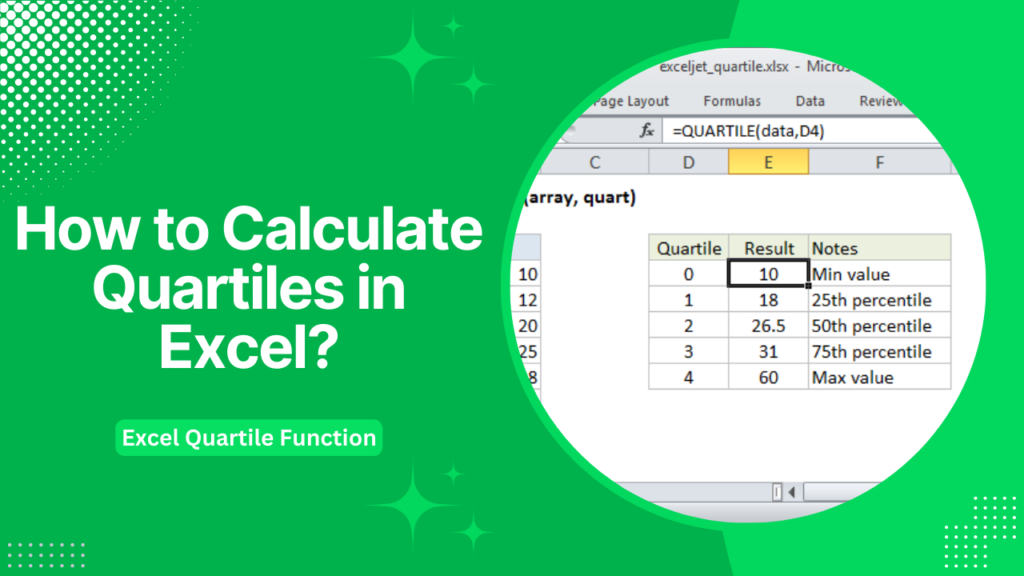
Excel provides convenient functions to calculate quartiles. The QUARTILE.INC function is commonly used, which uses the inclusive method to calculate quartiles.
Here’s an example:
“`
=QUARTILE.INC(data_range, quartile_number)
“`
Interpreting quartiles
Quartiles allow us to gain insights into the spread and skewness of the data distribution. Q1 indicates the point below which 25% of the data falls, while Q3 indicates the point below which 75% of the data falls. The interquartile range (IQR) is the range between Q1 and Q3, providing a measure of the dispersion of the middle 50% of the data.
Technological applications
Understanding quartiles is especially relevant in technology fields where data analysis is essential. For instance, in cybersecurity, quartiles can help identify unusual patterns of network traffic that may indicate a potential security breach. In artificial intelligence, quartiles can be used to evaluate the performance of models by analyzing the distribution of their prediction errors.
In conclusion, quartiles are a crucial tool for data analysis in the technology industry. They provide valuable insights into the distribution and characteristics of data, allowing professionals to make informed decisions based on statistical measures.
Frequent Questions
What are quartiles in Excel and how are they calculated?
Quartiles in Excel are statistical measures that divide a dataset into four equal parts. They are calculated using the QUARTILE function, which takes the range of values and the desired quartile as inputs. For example, =QUARTILE(A1:A10, 1) would calculate the first quartile of the data in range A1:A10.
Can quartiles in Excel be used to analyze large datasets?
Yes, quartiles in Excel can be used to analyze large datasets. Quartiles provide a way to summarize and understand the distribution of data by dividing it into four equal parts. This can be helpful in identifying outliers, understanding the spread of the data, and making comparisons between different subsets of the dataset.
Are there any alternatives to using quartiles in Excel for data analysis?
Yes, there are alternatives to using quartiles in Excel for data analysis. One alternative is using the PERCENTILE function, which allows you to calculate percentiles other than quartiles. Another alternative is using specialized data analysis software, such as Python’s NumPy or R’s dplyr, which offer more advanced statistical functions and options for data analysis.
In conclusion, understanding quartiles in Excel is an essential skill for technology enthusiasts. These statistical measures allow us to analyze and interpret data efficiently, enabling us to make informed decisions based on accurate insights. By utilizing the quartile function in Excel, we can easily identify trends, detect outliers, and assess the distribution of our data sets. With this knowledge, we can optimize processes, improve performance, and ultimately drive innovation in the ever-evolving field of technology. So, embrace the power of quartiles in Excel and unlock the full potential of your data analysis capabilities.